Median is the middle point of the population and has its place when the range doesn’t skew too much. I think a good representation of income is by percentages, as in “90% of people make $x,000 or below”. This chart had dated (2010) data but its a better representation than I’ve found elsewhere
Its median is tool for understanding data but it doesn’t paint a complete picture and can’t be representative without other context. For example, if you have a bimodal distribution, the median doesn’t tell you much just how like the average doesn’t tell you much. There are other examples like this.

Is this fact/accurate??
Excluding top 1000 drops the average in half??
Definitely a reason to only ever use median instead.
Nah there’s no way this is accurate.
Median simply eliminates outliers. If the picture is true, the median should be around 35k
Median is the middle point of the population and has its place when the range doesn’t skew too much. I think a good representation of income is by percentages, as in “90% of people make $x,000 or below”. This chart had dated (2010) data but its a better representation than I’ve found elsewhere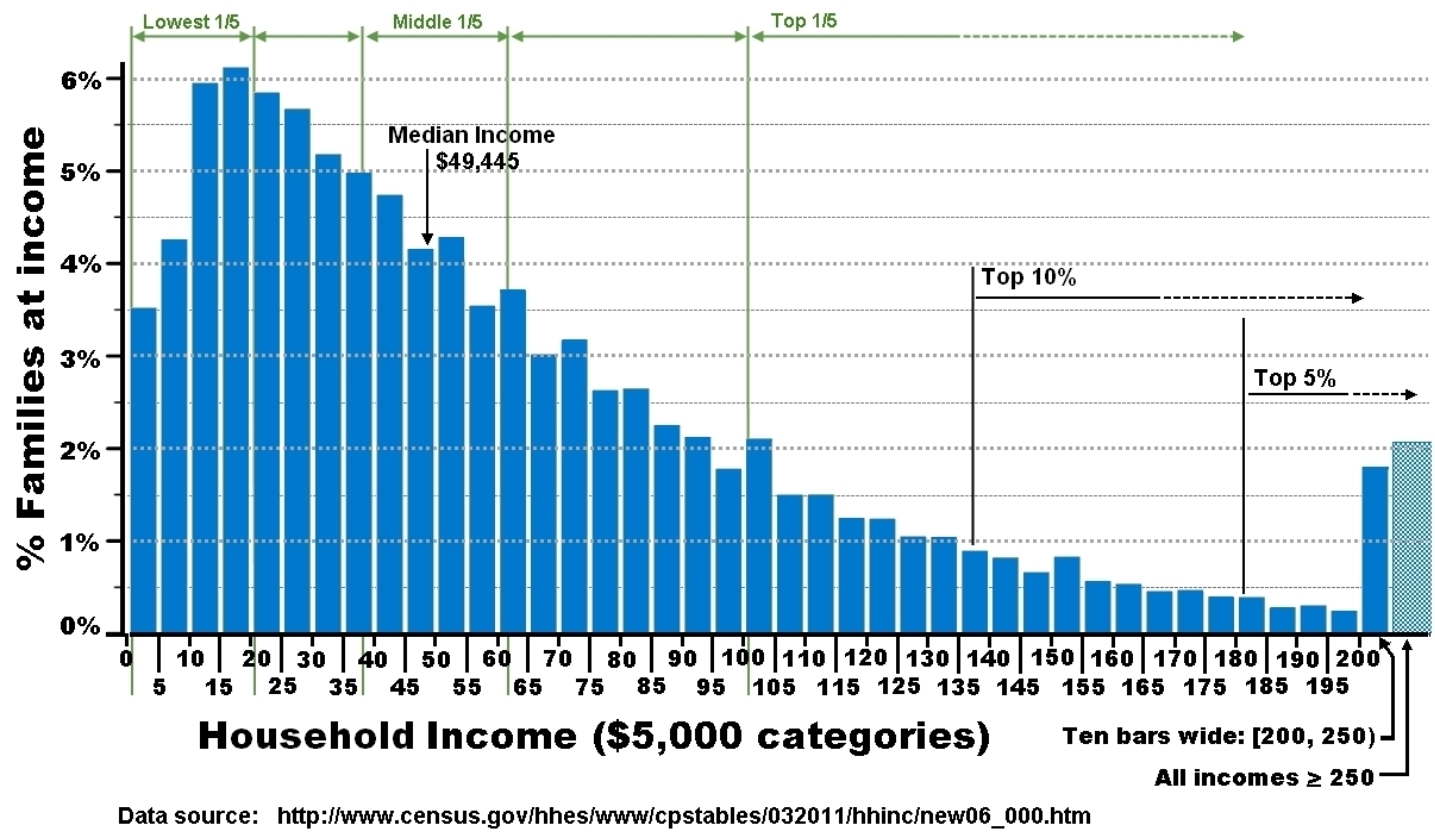
Thanks. That graph shows the Mode, which skews even lower.
Massive skews and tails are why you use median.
Its median is tool for understanding data but it doesn’t paint a complete picture and can’t be representative without other context. For example, if you have a bimodal distribution, the median doesn’t tell you much just how like the average doesn’t tell you much. There are other examples like this.
what? the mode is $15k/yr?
Whole lot of wage theft going on.